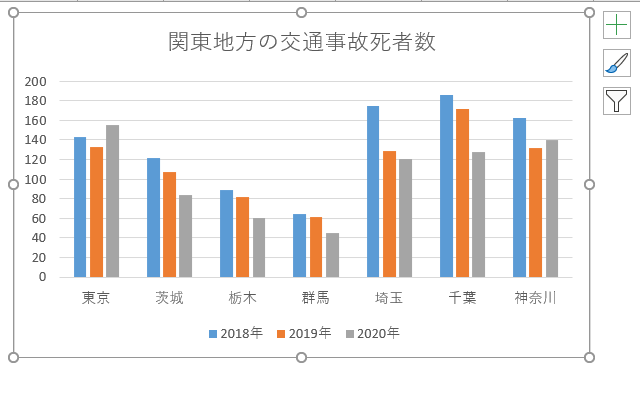
グラフの項目軸と凡例はデータの行と列の数で決まります。
例えば以下のデータの場合
- 行(都道府県):7行
- 列(年):3列
数の多い行(都道府県)が項目軸、数の少ない(年)が凡例に設定されます。
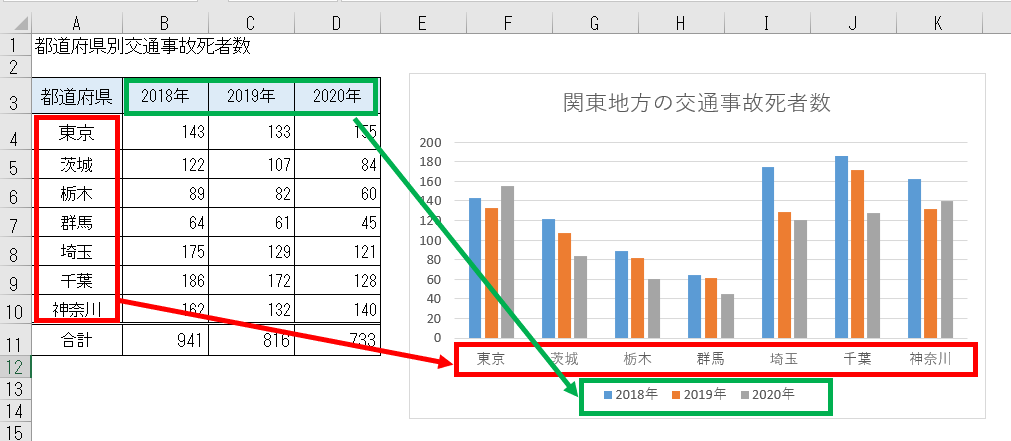
この項目軸と凡例を逆にする方法の説明です。
目次
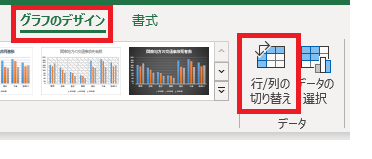
項目軸と凡例の入替方法
(1)変更するグラフエリアをクリックします。
(2)リボン > [ グラフのデザイン ] > [ データ ] グループ > [ 行/列の切り替え ] をクリックします。
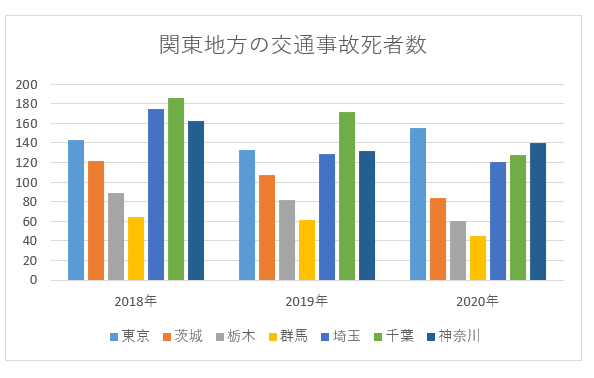
項目軸と凡例が入れ替わりました。
他の方法
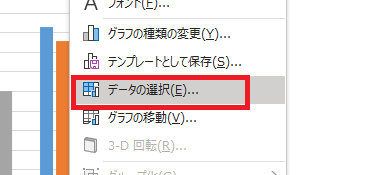
(1)変更するグラフエリアをクリックします。
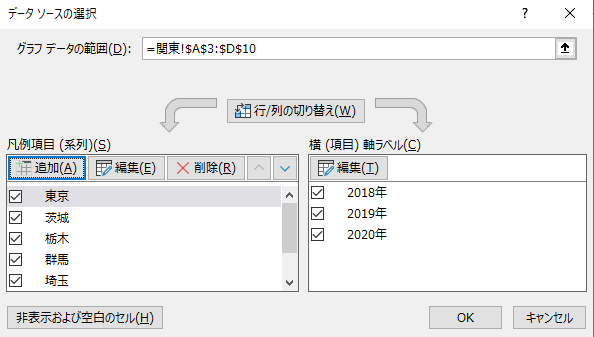
(2)リボン > [ グラフのデザイン ] > [ データ ] グループ > [ データの選択 ] をクリックします。
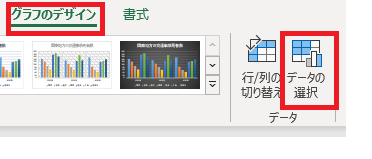
もしくは、グラフエリアを右クリックし、[ データの選択 ] をクリックします。
(3)データソースの選択画面の「行/列の切り替え」をクリックします。
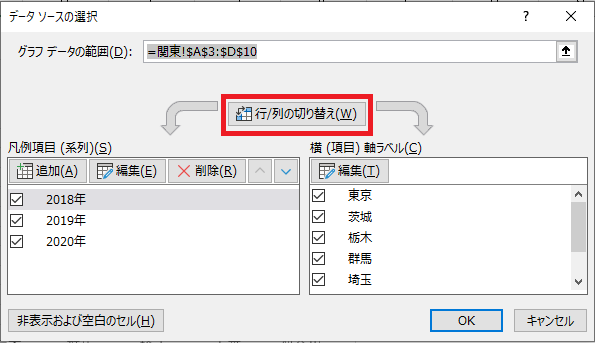
凡例と項目軸が入れ替わります。